

Vidocq 0.4.0-RC1 is on Maven Central. As for 0.3.0, the whole family went out together: eighteen families, tagged
v0.4.0-RC1, from vidocq-parent to the runtime and its CLI. Two of them, Peano and Ibarra, are released for the
first time. In the sixteen repositories that already had a tag, about 2,000 commits landed since v0.3.0, and the
BUG.md files of eight of them record at least 169 bugs closed on the way. It is still an alpha, and a release
candidate: we want you to try it before 0.4.0, planned for the end of November.
What is in it, in one list:
-
Jakarta Servlet 6.1, through Foy. Servlets, filters, listeners,
web.xmland security run in a Vidocq application, on the same HTTP server as REST. The official TCK: 1707 of 1714 tests pass, 0 failures. -
Two new bricks. Peano implements Jakarta Expression Language 6.0 (official TCK: 361/361). Ibarra implements Jakarta Pages 4.0 (official TCK: 682/682) and compiles your pages at build time.
-
MicroProfile 7.2. JWT Authentication 2.2, OpenAPI 4.2 and Telemetry 2.2, on OpenTelemetry 1.66, with the eight MicroProfile TCK runners of the assembled runtime green: 1888 tests.
-
One tool for the CLI and the Maven plugin, an application BOM and parent,
@VidocqTest, a project-awarevidocq doctor, shell completion,vidocq update, and a first test written on day one. -
A development loop. A dev console with live panels, continuous testing, dev services, and a dev MCP server that lets a coding agent ask the running application what it is doing.
-
Vaadin runs on Vidocq, in dev mode, packaged and in a jlink image.
-
Proof outside Vauban. Every brick now runs on Weld SE, and the MicroProfile ones on Open Liberty too.
-
Quality you can see. SonarQube and JaCoCo analyse the pull requests of each brick, and three bricks are at zero open issues.
The sections below take them in that order. The last one lists the fixes, brick by brick. Everything here is on the 0.4.0-RC1 line of the documentation; each brick keeps its own What’s new page, which says what landed after 0.3.0 and links to the section that documents it.
Jakarta Servlet 6.1, through Foy
Foy, the Servlet implementation of the family, was a standalone brick in 0.3.0. In 0.4.0 it is a Vidocq extension,
vidocq-runtime-foy-servlet-extension, and a Servlet application is an ordinary Vidocq application: your servlets,
filters, listeners, web.xml and ServletContainerInitializer`s are served on the HTTP server the runtime already
starts, with Vauban providing the CDI beans behind them. CDI works the way you expect: the request context is active
for every request, filters and listeners are beans, and a `@SessionScoped bean lives with the HTTP session.
-
Security. Foy takes the
IdentityStorebean of your application, or, in development, users declared invidocq.properties(vidocq.servlet.users.<name>.passwordand.roles), and enforces the security constraints of yourweb.xml, including form, basic and client-certificate authentication. -
An example.
vidocq-runtime-foy-servlet-example, the Vidocq Bistro: servlets, a filter and a session listener as CDI beans, a@SessionScopedbasket, a@RequestScopedbean shared by the request, and JSP pages (see below). -
The dev console knows about it. The startup report and the console list the context path, the servlets and filters with their mappings, and the listeners.
-
Servlet applications answer in UTF-8 by default, and a servlet application under a context path other than
/no longer answers 404.
The measure that matters is the official Jakarta Servlet 6.1 TCK:
| Run | Result |
|---|---|
|
1707 passing of 1714 run, 7 skipped, 0 failures, 0 errors |
|
1704 of 1714 |
The seven skipped tests are server push, which Chappe does not implement. When we started Foy, it passed 920 of those 1714. The road from there is the 34 Servlet fixes of the last section: sessions, dispatching, async, upgrade, error pages, security. One limit is stated plainly in the documentation: the session scope is Vauban-only in Foy for now.
Two new bricks: Peano and Ibarra
Peano implements Jakarta Expression Language 6.0, and passes the official TCK, 361 tests out of 361, on Temurin 25.
It is the engine behind #{…} in pages, and it is a dependency of Ibarra rather than something you configure.
Ibarra implements Jakarta Pages 4.0, what you may still call JSP. The official TCK passes 682 of 682. The design
choice is the one of the rest of the family: no work at startup that a build can do. vidocq:generate compiles your
pages with Ibarra into the application module, and a page that does not compile fails the build instead of failing the
first request that asks for it. The runtime extension, vidocq-runtime-ibarra-pages-extension, serves them through
the Servlet extension, and an application made of pages only can be deployed. In a project: vidocq extension add
ibarra-pages. The Bistro example shows pages next to servlets.
Both ship named Java modules, like every brick, and both are documented on the 0.4.0-RC1 line.
MicroProfile 7.2
The runtime now targets MicroProfile 7.2, and the three specifications that changed are implemented:
-
JWT Authentication 2.2 (Cervantes): RS256 and ES256 are both accepted when no algorithm is configured, PEM keys of either family work, a configured algorithm is checked by family, and a bad configuration fails the start with a
DeploymentExceptioninstead of failing every token at request time. Official TCK: 208/208. -
OpenAPI 4.2 (Grimm): the 4.2 features (unknown Schema properties as extensions,
@Headerexamples, method-level@ExternalDocumentation,@Digits), model sources combined in the order the specification sets, and every@Schemaand@SchemaPropertyattribute reaches the document. Official TCK: 364 tests, plus 3 of our own: 367/367. -
Telemetry 2.2 (Humboldt), on OpenTelemetry 1.66:
code.function.nameon@WithSpanspans,@WithSpan(inheritContext = false), nothing lost on export (exceptions, event names, structured values, double metric points), and the OTLP exporters work on the module path. Official TCK 2.2: 85/85.
One precision, because it matters for the word "compatible". The MicroProfile 7.2 finals are still under ballot at the Eclipse Foundation. We ran the TCKs of the release candidates, which are byte-identical to the finals, and they are green. We will run them again on the finals the day they are on Maven Central, and not before we say "MicroProfile 7.2 compatible".
Every brick on any CDI container
A brick should not need Vauban to be correct, and Vauban should not be the only thing proving it. Each brick now
has an <brick>-it-other-containers module that runs its jars, unchanged, under Weld SE on a plain class path and,
for the MicroProfile bricks and Champollion, as a WAR on Open Liberty, with the server’s own implementation of that
specification turned off. Cassini and Foy, which an application server replaces with its own Jakarta REST and Servlet,
are proven on Weld SE only.
That found real bugs, and they are fixed: normal-scoped beans could not load outside Vauban, because the build wove a
constructor taking a vauban-api type that was provided (Knock, Heisenberg, Cervantes, Humboldt); Heisenberg keyed
metric names and configuration overrides by Weld’s subclass; Humboldt’s span finalizer turned every exception, a 404
included, into a 500. A brick now depends on APIs, and its Vidocq extension brings the implementations. The page of
each brick proven on Open Liberty says which server features to keep off, in a WARNING block its Open Liberty module
tests.
Vaadin
A Vaadin application runs on Vidocq, in dev mode with vidocq:dev, packaged with vidocq:package, and in a jlink
image. The story of how we got there, and of what we asked from Vaadin, is in
its own post; what changed in the runtime is that every fix it required is now generic:
-
The application layer can hold the application’s dependencies (
vidocq.app.layer=all), because Vaadin’s framework code is application code. -
vidocq:generateruns the brick processors over dependency jars, so a@WebListeneror aServletContainerInitializerin a plain jar works. The result is cached in~/.cache/vidocq/depgen. -
Jars keep their folder entries when Vidocq enriches them (Vaadin’s development mode copies no frontend file otherwise), and a Vaadin app shell works in a jlink image.
-
A guide for Vaadin in the documentation, with the two flags and the one
<phase>line the application needs.
The last fix came the night before the release. After mvn clean, vidocq:dev answered 404 on a Vaadin application
and vidocq:run answered 500, because nothing had built the project. vidocq:dev now builds a project nobody built,
and says so. We found it by checking the release candidate against a real Vaadin application, which is why the check
exists.
Developer joy: one tool, from vidocq create to a jlink image
A runtime can boot in 120 milliseconds and still lose a new user in the first ten minutes. That is not spent in the
runtime. It is spent in the pom, in module-info.java, in a warning nobody explains, in a command that works one
way and its Maven twin another. 0.4.0 is the release where we went after those ten minutes.
This is how. First we made the CLI and the Maven plugin one tool. Then we audited the result with the eyes of someone who has never seen Vidocq, found eleven bugs we did not like, and changed what an application has to carry. At the end, the session you get with 0.4.0-RC1, command by command.
Where we started: two tools that disagreed
Vidocq has always had two front doors. The CLI (vidocq create, vidocq dev, vidocq extension add…) is the
one the getting-started guide shows. The Maven plugin (vidocq:dev, vidocq:generate, vidocq:jlink…) is the
one the build actually runs, in CI and in your IDE.
Up to 0.3.0 they overlapped by accident rather than by design, and in August a user showed us where it hurt. They had
taken the Vidocq parent out of their pom, copied the compiler and plugin configuration into their own, and the
packaged application ran fine. vidocq dev did not:
WARNING: No Vidocq extensions discoveredThe reason was embarrassing and simple. vidocq dev and vidocq start booted the runtime from the CLI’s own
module path. They never read the pom, so the extensions the project declared were never there. The packaged
launcher worked because the plugin built it from the project. Two tools, two answers to "which extensions does this
application run with?".
That report (vidocq#47) is the seed of everything below. Thanks again to its author, who came back two months later to confirm the fix on a snapshot.
Step one: one implementation, two front doors
The fix for #47 was to stop the CLI from pretending to be a runtime. Since 0.4.0, vidocq dev runs vidocq:dev
in your project, and vidocq start runs vidocq:run, with ./mvnw when the project has one. The plugin
resolves the project’s dependencies, so both commands see exactly what your pom declares.
That fixed the symptom. The cause was wider: the two tools described the same facts twice. Which codegen bundle
goes with which extension, which module-info directives an extension needs, which extensions exist at all. The CLI
had a hand-written list of seven codegen bundles and a switch of module-info rules; the plugin had a naming
convention. When an extension gained a codegen bundle, the plugin saw it and the CLI did not.
vidocq#314 removed the duplication in three layers.
The extensions are the source of truth. Each extension ships a small descriptor,
META-INF/vidocq/extension.properties: its short id, a description, its codegen bundle, and what the application’s
module-info.java needs. The catalog both tools read is generated from those descriptors when the runtime is
built, so the CLI knows an extension before Maven has downloaded it.
One shared module does the work. vidocq-runtime-tooling holds the pom editor, the module-info.java editor,
the scaffolder, the doctor checks and the vidocq.properties reader. It depends on java.xml and nothing else.
The CLI uses it on the module path; the plugin uses it on the class path.
Each tool is a thin adapter. The CLI keeps its argument parser and its coloured output; the mojos keep their
@Parameter`s and their Maven log. Between them, a three-method `Reporter interface: success, warning, error.
The result is a simple contract: every command that edits or checks the project has a goal, and both run the same code. The commands that build or run the application run their goal.
| CLI | Maven plugin | How they agree |
|---|---|---|
|
|
The same scaffolder writes the project. |
|
|
The same editor writes the dependency, the codegen path and the |
|
|
The same catalog, the same test for an extension jar. |
|
|
The same facts, the same checks. |
|
|
The command runs the goal. |
|
|
The command runs the build. |
So the CLI is a convenience, never a requirement. A team that lives in Maven, in CI or in an IDE gets every
project-level function as a goal, with the same output. A developer who likes short commands gets
vidocq extension add knock-health instead of mvn vidocq:add-extension -Dextensions=knock-health, and the same pom
edit.
Step two: an honest audit
With the two tools agreeing, we did what we should do more often: we started from an empty directory, with the CLI
built from main, and ran everything a newcomer would run. create, doctor, extension add and remove,
config, build, start, dev with a live edit, test, idea, build jlink. Then the same again on a pom
without the Vidocq parent, the setup of #47.
The runtime side was already where we want it:
| Measured on an Apple M5 Max, JDK 25, a created application with REST + Health | Result |
|---|---|
Runtime start ( |
111 ms |
|
about 10 s |
A source change, from saving the file to the new answer (in-JVM layer swap) |
about 3 s |
|
119 ms (231 ms for the whole process, image 40 MB) |
The first contact was not. We logged eleven bugs, each with its issue and its BUG.md entry
(vidocq#339 lists them). A few of them, because they show the kind
of thing that costs a newcomer time while every maintainer has long stopped seeing it:
-
vidocq doctorwarned about a missing Maven wrapper on the projectvidocq createhad just written, becausecreatewrote no wrapper. -
The created application took the runtime’s version:
demo-app-0.4.0-SNAPSHOT.jar. -
The created pom carried two workarounds, with comments, for bugs of 0.2.0 fixed months ago.
-
vidocq create --name demo-appwrote a class calledDemoAppApp. -
Every build told you to add a
providestomodule-info.javathat a Vidocq application does not need. -
Every build printed three javac warnings that nobody explained.
-
The catalog described
mansart-dataas Jakarta Persistence; it is Jakarta Data. -
vidocq extension add mansart-persistencewrote a coordinate that does not exist, because that extension had no descriptor. -
On a pom without the Vidocq parent,
extension addwarned that the Vauban indexer was dropped, while the pom listed it and the build was right.
None of them breaks a running application. All of them make a first project look less finished than the runtime under it. 0.4.0-RC1 fixes ten of them, each with a test that would have caught it. The eleventh, the javac warnings, we kept on purpose: javac says that the classes Vauban writes in its last round will not be processed again, which is exactly what Vauban wants, and silencing it would mean turning off a check you may need for your own processors. The getting-started guide now says so, next to the three lines you will see, and an integration test fails the build of a created project on any other warning.
The audit also showed something no single bug captures: how much configuration an application carries. Adding
REST to an application meant three places. A dependency. A codegen bundle in the compiler’s
<annotationProcessorPaths>, with combine.children="append" so the inherited Vauban indexer survives. And eight
lines of module-info.java. We had three plugin goals (checkpom, check-module-info, complete-module-info) whose
job was to police that configuration. Tools that check what you wrote are good; not having to write it is better.
Step three: what an application no longer carries
An application BOM, and a parent made for applications
Until now, a created application inherited vidocq-runtime-parent, which was the root of the runtime’s own
build. It worked, but your application got our CI settings, our SonarQube configuration, the TCK list of our
repository, and a SNAPSHOT of a library it never used.
0.4.0 separates them, and keeps the name you already have in your pom:
-
vidocq-runtime-bommanages the version of every artifact an application may declare: the runtime, every extension, its codegen bundle, its dev-console companion, the test support. A reactor test fails when a published module is missing from it. -
vidocq-runtime-parentbecomes a parent made for applications. It imports the BOM and carries only what an application needs: Java 25, the Vauban indexer, pinned Maven plugins, and the Vidocq plugin with its checks and packaging. Both are published flattened: no parent, no profile, nothing of ours. -
The runtime’s own build moved to
vidocq-runtime-build, which no application inherits.
Upgrading is bumping one version. vidocq create and vidocq extension add stop writing versions on Vidocq
artifacts, and a created application gets its own version, 1.0.0-SNAPSHOT. Teams that have their own corporate
parent, like the author of #47, import the BOM instead, and we recommend that over copying anything from our
parent:
<dependencyManagement>
    <dependencies>
        <dependency>
            <groupId>io.vidocq.runtime</groupId>
            <artifactId>vidocq-runtime-bom</artifactId>
            <version>0.4.0-RC1</version>
            <type>pom</type>
            <scope>import</scope>
        </dependency>
    </dependencies>
</dependencyManagement>
The codegen bundle follows the dependency
Vidocq does at build time what other runtimes do at startup: Vauban indexes your beans and generates their proxies with an annotation processor, and extensions such as REST or Jakarta Data add their own processors. That is where the 120 ms come from, and it is not negotiable. Making you write it twice is.
With 0.4.0, the Vidocq plugin, declared as a build extension, puts the codegen bundle of each Vidocq extension in your
dependencies on the compiler’s processor path itself. The application parent declares it that way, so the
maven-compiler-plugin block disappears from a created pom. Adding an extension is one dependency again, and
checkpom becomes a safety net rather than a daily error. Under your own parent, one attribute does the same:
<plugin>
    <groupId>io.vidocq.runtime</groupId>
    <artifactId>vidocq-runtime-maven-plugin</artifactId>
    <version>0.4.0-RC1</version>
    <extensions>true</extensions>
</plugin>
We did not take this step lightly, because injecting configuration that the IDE cannot see is how you get a build
that works on the command line and an IDE that compiles without your processors. So we checked before we
shipped. On a created project with its codegen path removed, Maven 3.9.16 (the version of the wrapper create
writes), the same offline, 3.9.9, 3.9.11 and 4.0.0-rc-5 all build it, and IntelliJ IDEA 2026.2’s Maven import
writes the same processor path, entry for entry, as with the explicit path. A path you already declared is kept
and never doubled, so a 0.3.0 pom builds unchanged.
One check paid for itself on the spot. Our first version registered the participant the modern way, with
@Named, and on Maven 3.9.9 it simply never ran: no error, no warning. 3.9.9 reads that registration with a
library too old for Java 25 class files and skips the component. A prototype compiled for Java 17 ran fine, which is
how we found it. The plugin now registers it in a Plexus descriptor, every Maven version above runs it, and a test
keeps it that way.
A first test, on day one
TDD is a rule of our ecosystem, and vidocq create used to write a project with nothing to test it with:
vidocq test had nothing to run. 0.4.0 adds vidocq-runtime-junit and its @VidocqTest annotation. A test class
gets the application started in a JVM of its own, on a free port, once for the class, and stopped after its last
test:
@VidocqTest
class HelloResourceTest {

    @Test
    void saysHello(VidocqApplication application) {
        VidocqResponse response = application.get("/hello");

        assertEquals(200, response.status());
        assertEquals("Hello from Vidocq!", response.body());
    }
}
That is the test vidocq create -x cassini-rest now writes, with the two test dependencies it needs, no version
on either. It runs in well under a second, boot included. The application under test is the real one, on the
module path of your tests, with your vidocq.properties: no mock container, no special mode.
One detail of the design came from a failure. Our first sketch had the test call the application with
java.net.http.HttpClient, and it failed with an IllegalAccessError: a test that Surefire patches into your
application module reads only what that module reads, and an application has no reason to require
java.net.http. So VidocqApplication carries the HTTP calls (get, post, request), from a jar that reads the
module for you.
The created project is finished in other ways too: a Maven wrapper, a .gitignore, a README with the commands that
work, and, when you leave out --name on a terminal, three questions (name, group, extensions from the catalog)
instead of an error. An integration test creates a REST application on every pull request, runs a real
mvn verify on it offline, and fails on a missing test run, a missing launcher, or a warning we did not expect.
What stays explicit, and why
module-info.java stays yours. Vidocq applications are Java modules, and a module declaration that a tool rewrites
behind your back is not a declaration any more. What changed is that you never have to guess it:
vidocq extension add writes the requires and opens an extension needs, marks each line with
// vidocq:<id>, and vidocq extension remove takes exactly those lines out again.
module com.example.todo {
    requires static java.compiler; // vidocq:cassini-rest
    requires io.vidocq.runtime.extensions.jakartaee.core.cassini; // vidocq:cassini-rest
    requires jakarta.cdi; // vidocq:cassini-rest
    requires jakarta.inject; // vidocq:cassini-rest
    requires jakarta.ws.rs; // vidocq:cassini-rest
    requires jakarta.json.bind; // vidocq:cassini-rest
    requires io.vidocq.cassini.api; // vidocq:cassini-rest
    opens com.example.todo; // vidocq:cassini-rest
    requires io.vidocq.runtime.extensions.microprofile.knock; // vidocq:knock-health
}
That is what vidocq create --name todo -g com.example -x cassini-rest followed by vidocq extension add
knock-health writes. The pom, for its part, got one dependency per extension, and nothing else.
A doctor that looks at the project
vidocq doctor used to check your machine: JDK, JAVA_HOME, wrapper, a pom, configuration keys. Useful, but the
questions newcomers actually ask are about the project. Why does my REST resource answer 404? Why does this extension
not start?
In 0.4.0, vidocq doctor (and vidocq:doctor, same code) also reads the project, from its sources, so it works
before the first compile:
| Check | Reports | --fix |
|---|---|---|
Codegen bundles |
an extension without its codegen bundle, a bundle whose extension is gone |
wires it, or removes it |
Vauban indexer |
processor paths that replace the parent’s and drop the indexer |
makes them append |
Module directives |
a |
adds it, marked |
Maven version |
a wrapper older than the Maven the ecosystem pins |
moves the wrapper to it |
HTTP port |
the configured port is taken |
— |
Every problem it can repair ends with ↳ Fix: vidocq doctor --fix (or the mvn vidocq:doctor line, when you ran the
goal). Under the application parent the codegen check knows that the plugin wires the bundles, so it does not ask you
for a path you no longer write. And the test that matters most to us: a project vidocq create has just written
reports zero warnings, with or without REST.
Here it is on a created project from which we deleted one line of module-info.java:
$ vidocq doctor
Vidocq doctor — environment & project checks
✔ Java version Java 25
✔ JAVA_HOME /Users/me/.sdkman/candidates/java/25-tem
✔ Maven wrapper mvnw found
✔ Vidocq project pom.xml references the Vidocq runtime
✔ Config vidocq.properties — 1 key, all recognized
✔ Extensions 2 extensions in the runtime dependencies
✔ Codegen bundles 1 wired by vidocq-runtime-maven-plugin
✔ Vauban indexer wired by vidocq-runtime-maven-plugin
✘ Module directives missing from module-info.java — cassini-rest: requires jakarta.ws.rs
↳ The application does not compile, or the module path refuses it.
↳ Fix: vidocq doctor --fix
✔ Maven version Maven 3.9.16 (wrapper)
✔ HTTP port 8080 is free
✘ One or more checks failed — see the hints above.
11 checks — 10 ok, 0 warning(s), 1 failed
$ vidocq doctor --fix
✔ module-info.java updated (requires/opens for cassini-rest)
…
✔ No blocking issues found.
11 checks — 11 ok, 0 warning(s), 0 failedA CLI that says less and helps more
A few smaller things, each from the audit:
-
vidocq infogives the environment and a summary of the project: main module, runtime version, number of extensions, active profile and where it comes from. It reads your files; it does not start Maven. -
vidocq config set vidocq.htpp.port 8081writes the key, and tells you at once that no Vidocq module reads it, and thatvidocq.http.portis the closest one. Before, onlydoctornoticed, if you thought of running it. -
The CLI tells you when a newer build exists: at most once a day, on a terminal, never in a script, never after
versionorcompletion, silent when the network is not there.VIDOCQ_NO_UPDATE_CHECK=1turns it off. -
vidocq extension list --availableused to say "offline" every time, because the remote registry it looked for never existed. The catalog shipped with the CLI is the source, and it is now shown by family: Jakarta EE, MicroProfile, data, web.
Completion, updates and editors
The CLI is a distribution you install once, so it should be pleasant to live with. Four things landed after the audit:
-
Completion for the whole command line.
vidocq completion installwrites the script under~/.vidocq/completionand sources it from~/.zshrcor~/.bashrc, the shell taken from$SHELL; running it again never duplicates the block, andvidocq completion uninstalltakes it out. It completes sub-commands, options and values: aftervidocq extension add, the extensions that are not in the pom yet; aftervidocq extension remove, the ones it declares; aftervidocq config getorset, the keys of yourvidocq.properties. None of it starts a JVM, so the tab key answers at once. The installed script follows the CLI that runs, andinstall.shsets it up for you unless you setVIDOCQ_NO_COMPLETION=1. -
vidocq updateupdates the CLI itself: a release goes to the latest release, a SNAPSHOT to the latest SNAPSHOT build, and--checkonly reports. This is what the once-a-day hint above points at. -
Editors.
vidocq vscodewrites.vscode/for VS Code’s Java extension: its language server on Java 25, which Vauban’s annotation processors need, with its automatic build off so thatvidocq devalone writestarget/classes, tasks fordev,runandtest, and a debug configuration attached tovidocq dev.vidocq eclipsewrites.eclipse/for Eclipse IDE 2026-09 (Maven builds and a debug configuration, listed under Run Configurations), and the application parent now turns m2e’s annotation processing on, without which Eclipse built an application with no bean index.vidocq idea, still experimental, writes IntelliJ’s shared run configurations into.run/. Each has its goal (vidocq:vscode,vidocq:eclipse,vidocq:idea), and--checkverifies the files in CI. -
vidocq testrunsmvn vidocq:test: the tests on every change, without the application. More on it below.
In all of this the commands that edit or check the project run the same code as their goals, so a team that never installs the CLI loses nothing.
Your first ten minutes with 0.4.0-RC1
Install the CLI. It is a self-contained distribution from Maven Central; no Maven involved:
curl -fsSL https://vidocq.dev/install.sh | shCreate an application with REST:
vidocq create --name todo -g com.example -x cassini-rest
cd todoYou get a pom on the application parent with your own version, a module-info.java, a REST resource, a
vidocq.properties, a first test that boots the application and calls the resource, a Maven wrapper, a
.gitignore and a README:
.gitignore
README.md
mvnw
mvnw.cmd
pom.xml
src/main/java/com/example/todo/HelloResource.java
src/main/java/module-info.java
src/main/resources/vidocq.properties
src/test/java/com/example/todo/HelloResourceTest.javavidocq doctor has nothing to say: 11 checks — 11 ok, 0 warning(s), 0 failed.
Start dev mode, open the dev console on http://127.0.0.1:8888/, and edit HelloResource: the next request
answers with your change about three seconds after you save.
vidocq devIn a second terminal, keep the tests running on every change:
vidocq testAdd health checks: one command, and the pom and module-info.java are both right.
vidocq extension add knock-healthShip a self-contained image that brings its own trimmed JDK:
vidocq build jlink
./target/dist/bin/todo
And if your team prefers Maven alone, every step above has its goal, from vidocq:create to vidocq:jlink.
A development loop
The runtime boots in about 120 milliseconds; a loop that tells you nothing about what it started wastes them. 0.4.0 makes the application describe itself.
Every boot says what it is. Version, commit and build time (Vidocq 0.4.0-RC1 (…)), the Java version, the launch
mode (dev, test or prod, with the signal it was read from) and the debugger address, then a startup report just
before Started in: the listeners with the address they really bound (so port=0 prints the real port), the REST
routes, the Servlet context, the migrations. A terminal gets the banner, a container or CI gets one log line, and the
console logs are one aligned line per record unless you configured logging yourself.
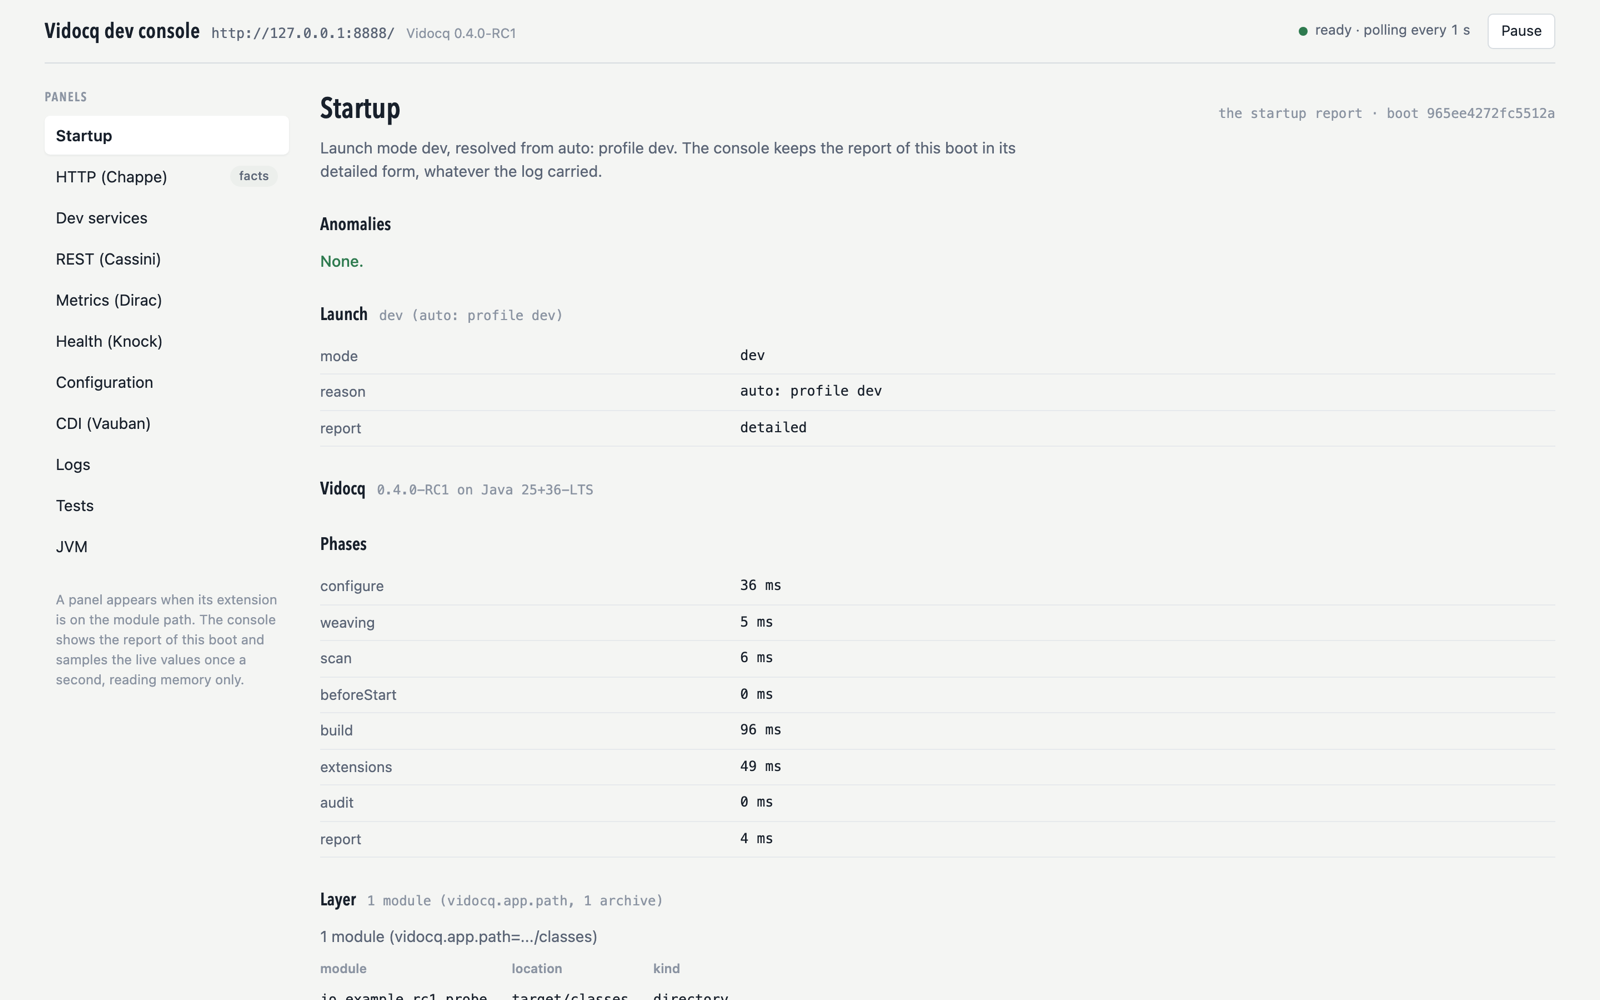
Every jar built on vidocq-parent carries META-INF/vidocq/build-info/<artifactId>.properties, so a stack trace that
mixes two builds can be told apart at a glance.
The dev console. Under mvn vidocq:dev (or vidocq dev), Vidocq dev console: http://127.0.0.1:8888/ opens a
read-only page on a loopback listener of its own. Each extension contributes a live panel, and the console adds its own:
| Panel | What it shows |
|---|---|
REST (Cassini) |
one card per mount, sampled about once a second: requests per second, responses by class, with the Swagger UI one click away |
Health (Knock), Metrics (Dirac) |
the checks and their last result; one card per metric registry, application first |
CDI (Vauban), Configuration |
beans by scope; every |
Logs |
the last 500 records, and a log level you can change without a restart |
Mansart Data and pools |
the entity catalogue, any repository method run with JSON arguments (a write asks first and rolls back by default), a JDQL editor with CSV export and import, and, for each pool, its tables and a SQL editor |
Migration |
per datasource, the schema version and what is pending, with migrate and clean and migrate as buttons |
Servlet (Foy), MCP |
context path, servlets, filters and listeners; the MCP tools, prompts and resources, called through the
application’s own |
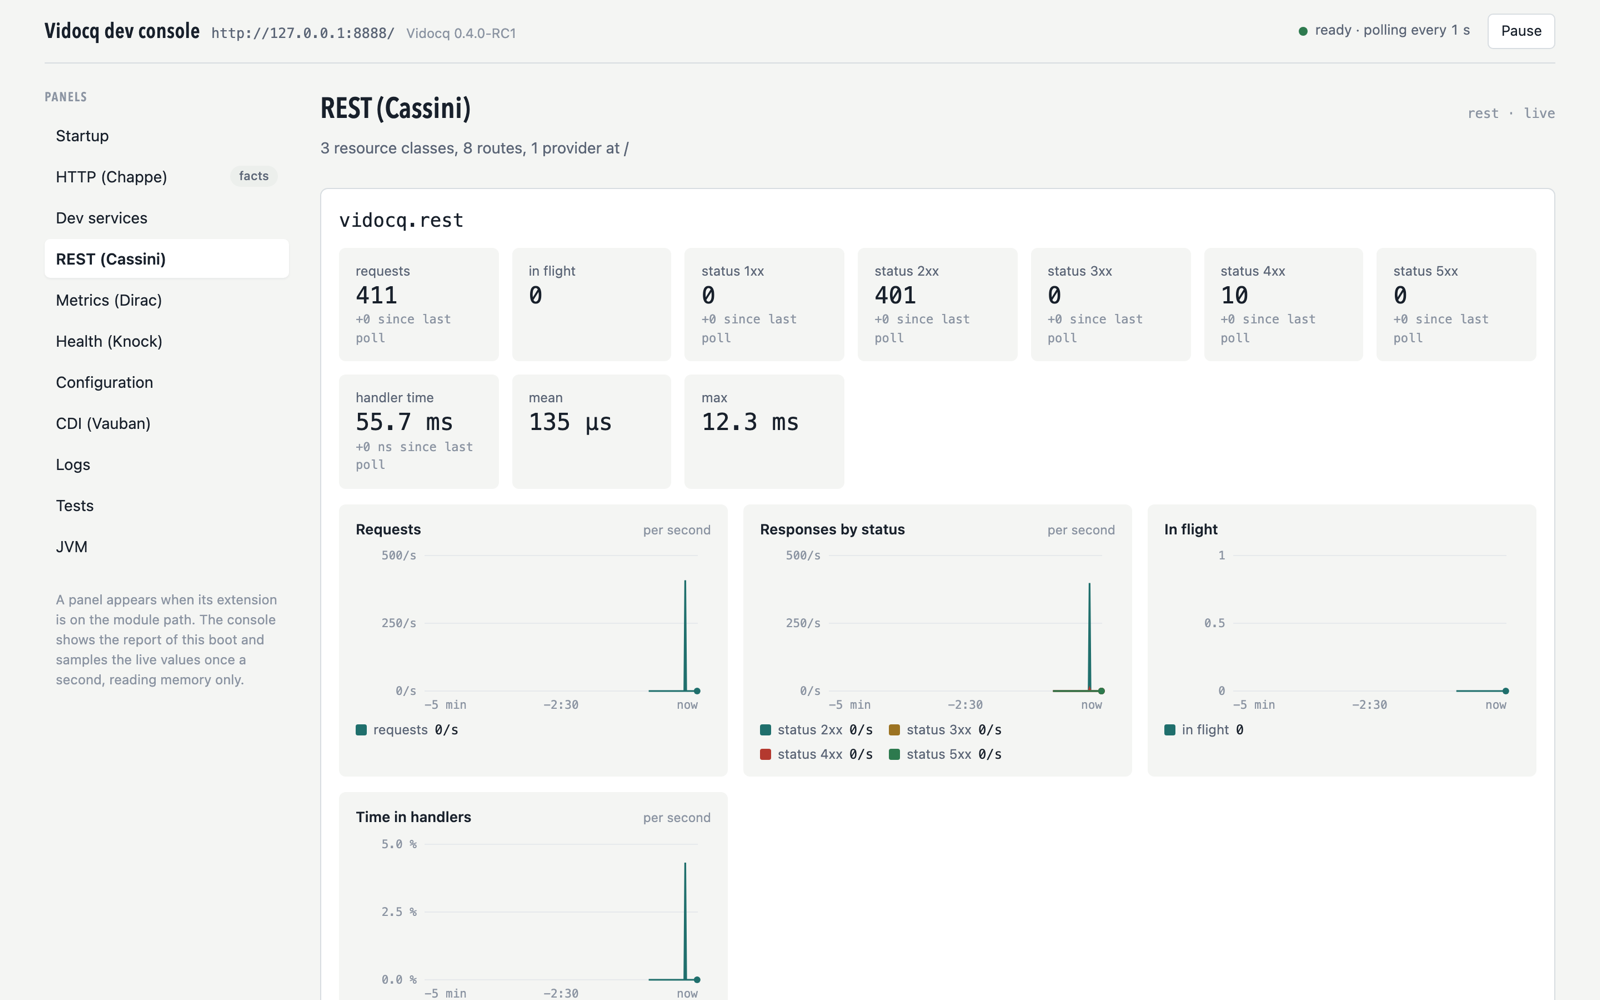
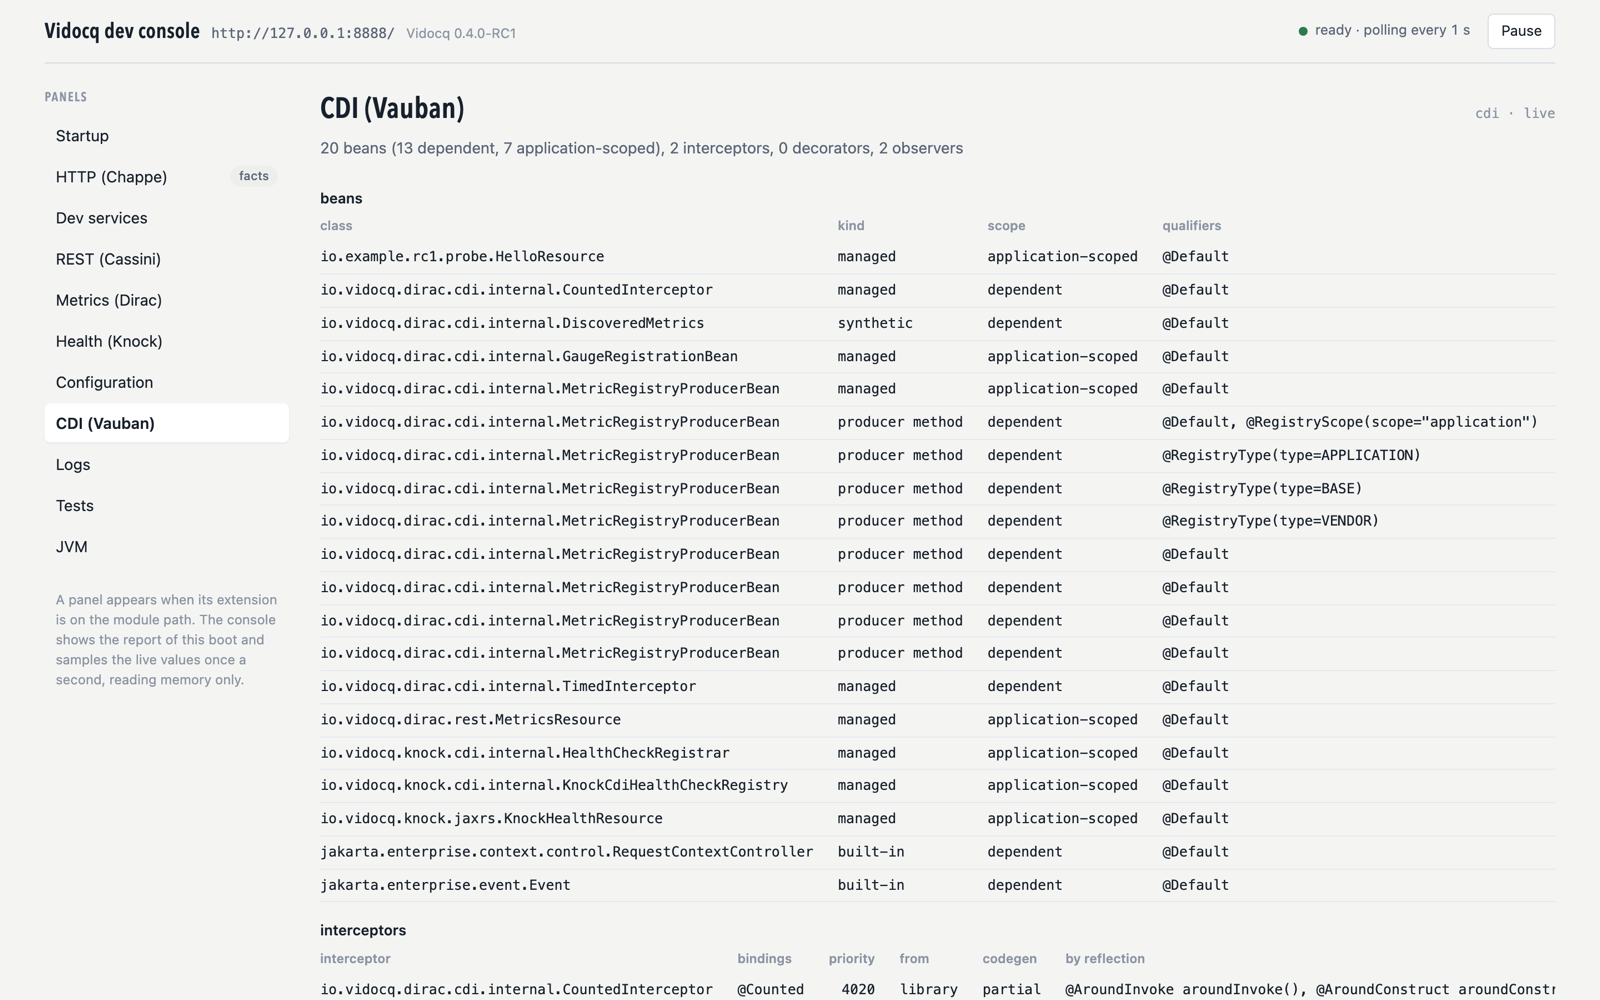
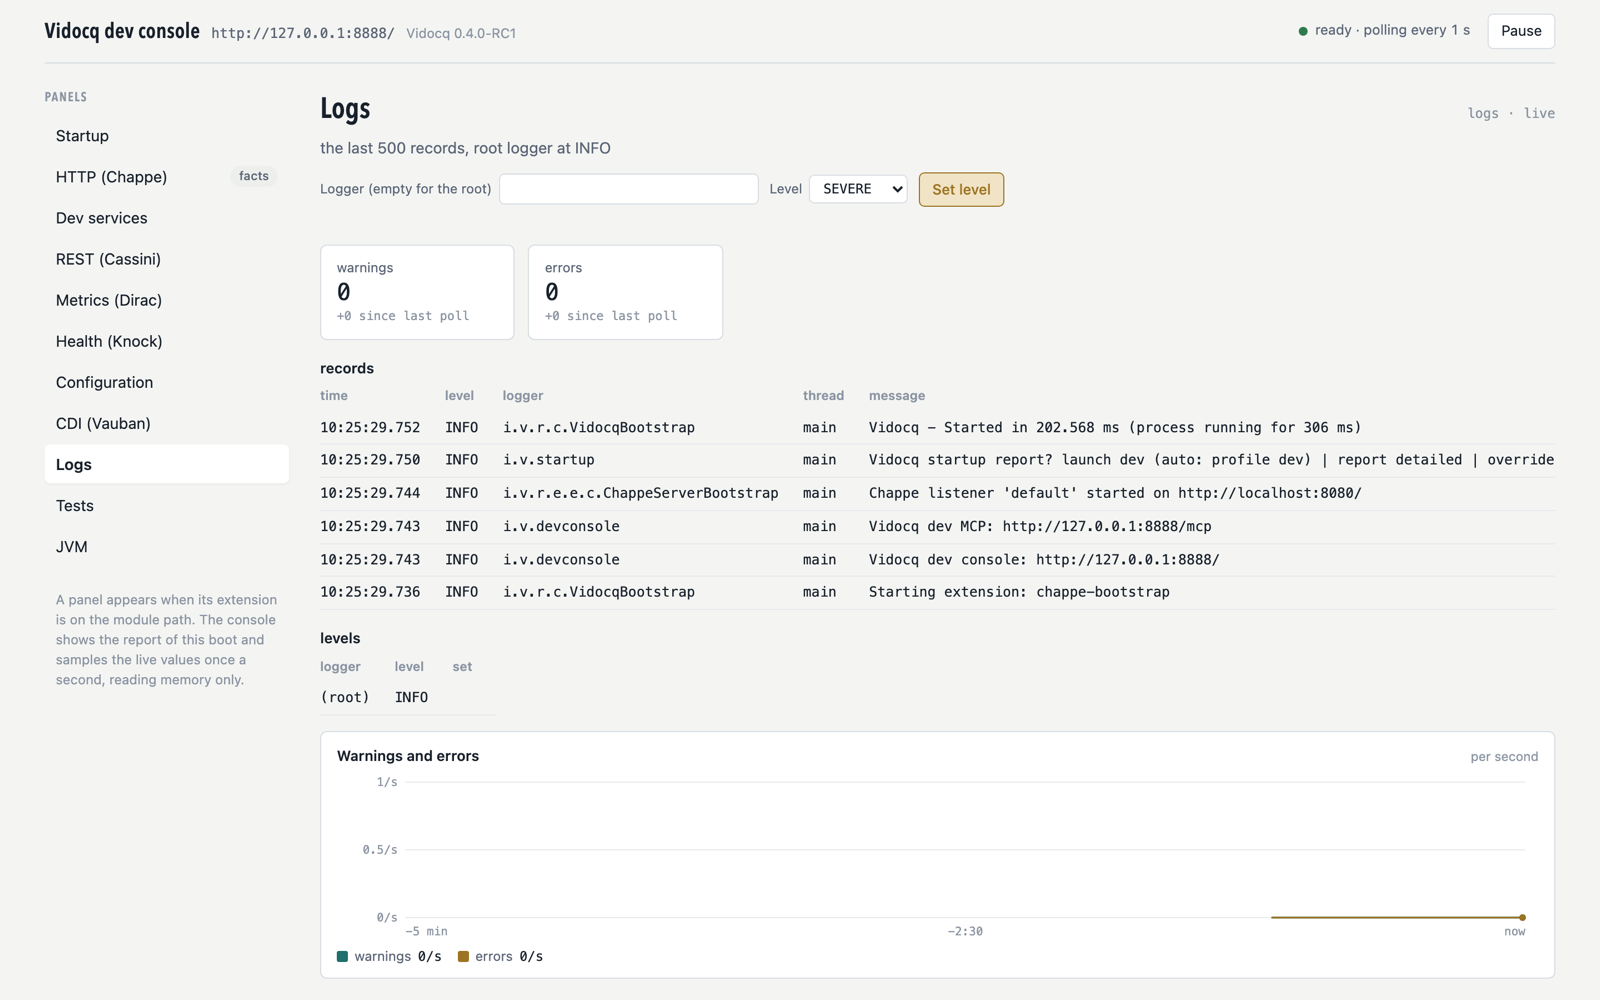
The actions are behind an origin check and a token generated at each boot, and the five minutes of history behind
every chart live on the server, so a hidden tab loses nothing. The console is a development tool and stays one: it
is added by vidocq:dev itself, so there is nothing to declare, and the -dev panel modules are never packaged.
A dev MCP server for coding agents. In a dev launch the console is also an MCP server, at POST /mcp on its own
listener, with the console’s panels as read-only tools. A coding agent can ask the running application which beans
exist, which configuration it read, what the last log lines say or whether a health check is down, instead of
guessing from the source. It is read-only on purpose.
Continuous testing. vidocq:dev runs the application’s tests after every reload, or alone after a test-only change
without reloading, and the new vidocq:test goal (vidocq test) does the same without the application. With
@VidocqTest from the previous section, a test of the real application is a few lines.
Dev services. PostgreSQL and Keycloak start in containers (Testcontainers 2) named vidocq-dev-<application>-…, so you
can find them. They are visible in the console, aware of vidocq.properties (a PostgreSQL container starts only for an
application that is on PostgreSQL, never in place of your H2 URL), and available to vidocq:run and to tests, not only
to vidocq:dev. Each key an application gets from a dev service is marked
-Dvidocq.dev.provided.<key>=<provider>, so nothing arrives by magic.
Smaller things that cost us time before. vidocq:run runs the application once, in a JVM forked as the production
launcher does. vidocq:dev passes -Dvidocq.* on to the application. The debugger listens on this machine only, where
it used to listen on every interface. Every main shape Java 25 accepts starts the application. A boot that fails stops
what it had already started. Schema migrations find their scripts where the application runs, in the module layer.
Dev extensions: bring your own panel
The panels above are not special. Each one is a dev extension, written against two small interfaces that an extension of yours can use as well. An extension already says, once per boot, what it found: that is its section of the startup report. A panel adds what it is doing: values sampled about once a second, the charts to draw, and optionally actions.
There are two shapes. The all-in-one one is the shortest: your extension class is also the panel.
public final class AcmeCacheExtension implements VidocqExtension, DevConsolePanel {

    private static final List<Chart> CHARTS = List.of(
            new Chart("entries", "Entries", List.of(Series.area("entries"), Series.ceiling("entries"))));

    private volatile AcmeCache cache;           // set in onStart, cleared first in onStop

    public String id() { return "acme-cache"; }                               // the section, the tab

    public void contribute(StartupReportContext context, StartupReportSection section) {
        AcmeCache c = cache;                                                  // boot facts, once per boot
        section.summary(c == null ? "not started" : c.capacity() + " entries max");
    }

    public List<Chart> charts() { return CHARTS; }                            // what the page plots

    public void sample(PanelSample out) {                                     // live values, every poll
        AcmeCache c = cache;
        if (c == null) return;
        out.gauge("entries", c.size(), c.capacity(), Unit.COUNT)
           .counter("hits", c.hits(), Unit.COUNT);
    }
}
That is the whole panel: contribute for the boot facts, charts and sample for the live half. It depends on
vidocq-runtime-devconsole-spi, an API jar of five small types, and nothing else of the console.
The catch is in the word all-in-one: whatever implements DevConsolePanel ships in every binary that has the
extension, whether or not anyone ever runs vidocq:dev. So the extensions of the runtime itself, Cassini’s REST
mounts, Knock’s health, Dirac’s metrics, Mansart’s pools, the schema migrations, the MCP server, use the split shape:
| Module | Holds | Depends on |
|---|---|---|
The brick |
Its read-only public API: a counter kept in memory, a registry, a snapshot |
Nothing of the console |
The runtime extension |
The integration and the startup-report section: boot facts, in every mode, production logs included |
|
The |
The live panel: sampled values, charts, actions, as a |
The runtime extension and |
The -dev module is a small Java module next to the extension, with the same parent and version, the artifact id
suffixed -dev and the module name suffixed .dev. vidocq:dev alone puts it on the module path of the application
it starts. Nothing else ever depends on it, and nothing that gets packaged contains it: a jlink image or a -dist
archive of your application never carries a panel, and the brick it describes does not even know that the console
exists. The Health panel of Knock, below, is one of these.
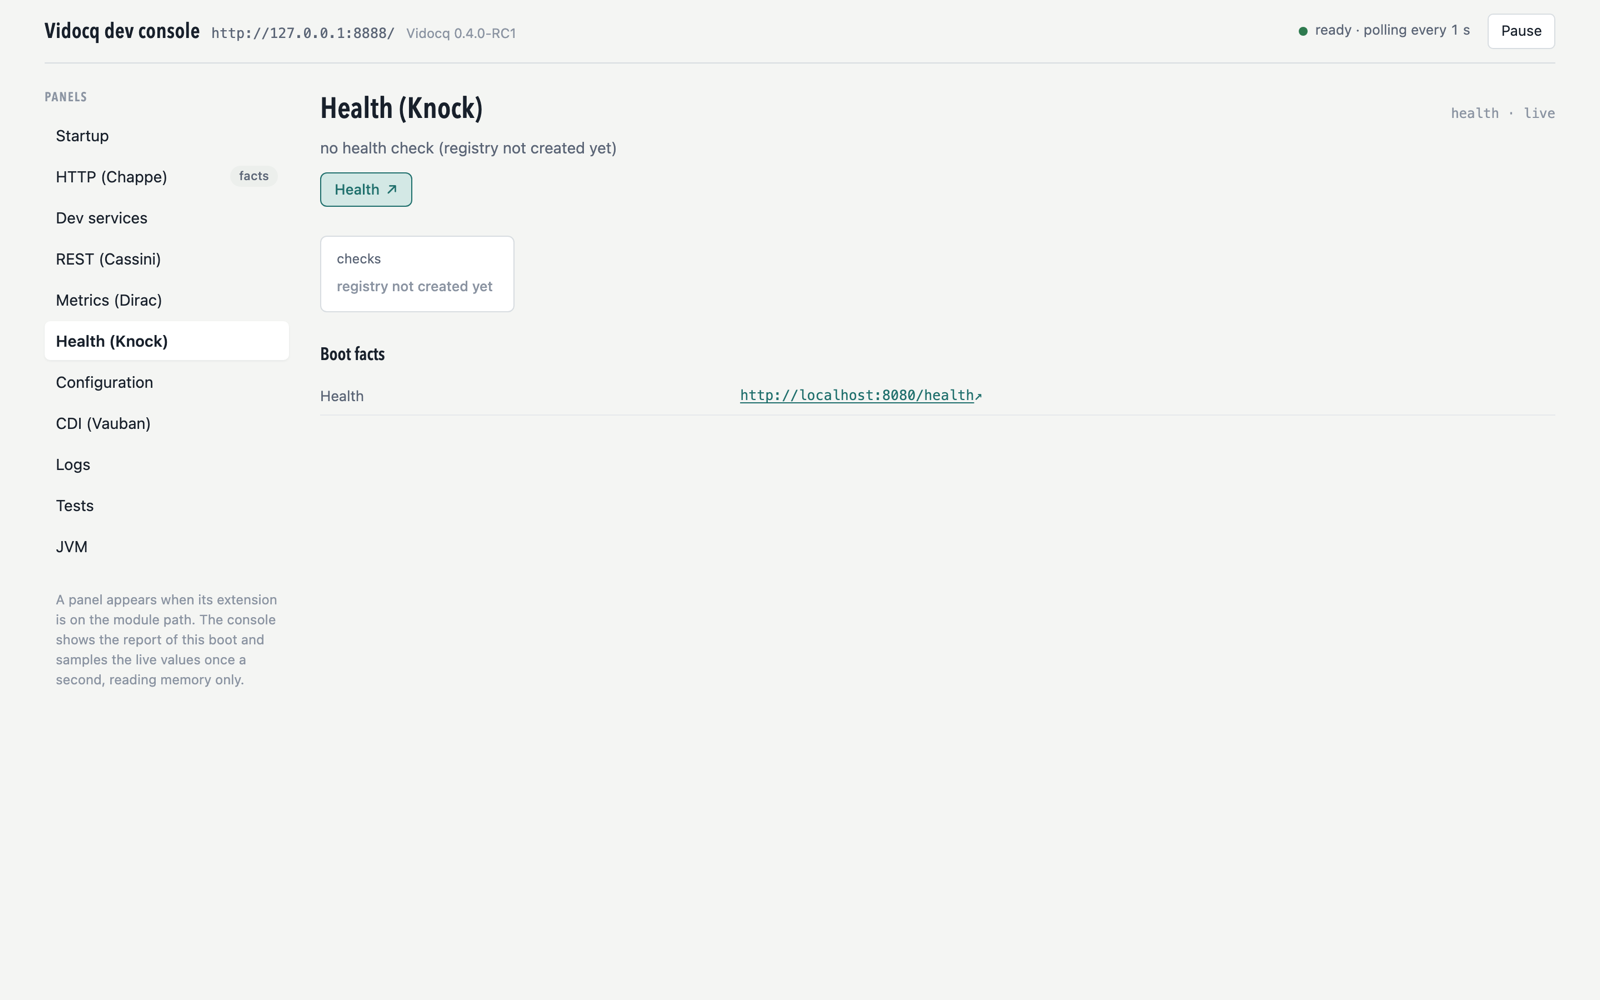
-dev module of the Knock extension: the checks of the application and their last result.A few rules keep a panel harmless, and the console documents them as a contract: sample reads memory only, never
blocks, never creates a bean, and never puts a secret in a value. An action, the kind of button the migration panel
offers, goes through the origin check and the per-boot token described above. And since the dev MCP server shows the
console’s panels to coding agents as read-only tools, a panel that keeps its values honest and free of secrets is
also one an agent can safely read.
Both shapes, the tests that go with them and a checklist are in
Writing a dev console panel. If you maintain an
extension with a state worth watching, a cache, a pool, a queue, a client, the panel is a few dozen lines, and
vidocq:dev shows it from then on.
New TCK figures
The TCKs are the part of this release we trust most, because we do not write them. Official suites, run on Temurin 25; the runtime figures are run against the assembled runtime, each test deployed the way an application would be.
| Specification | Result | Where |
|---|---|---|
Jakarta Servlet 6.1 new |
1707/1714 (7 skipped: server push) |
Foy, |
Jakarta Pages 4.0 new |
682/682 |
Ibarra |
Jakarta Expression Language 6.0 new |
361/361 |
Peano |
Jakarta REST 4.0 |
2538/2538 applicable (of 2670) |
Cassini |
CDI 4.1 Lite |
774/774 |
Vauban |
MicroProfile Config 3.1 |
378 |
assembled runtime |
MicroProfile Health 4.0 |
28 |
assembled runtime |
MicroProfile Metrics 5.1 |
127 |
assembled runtime |
MicroProfile Fault Tolerance 4.1 |
463 |
assembled runtime |
MicroProfile JWT Authentication 2.2 new |
208 (one TestNG group excluded) |
assembled runtime |
MicroProfile Rest Client 4.0 |
235 |
assembled runtime |
MicroProfile Telemetry 2.2 new |
85 (TCK release candidate) |
assembled runtime |
MicroProfile OpenAPI 4.2 new |
364 (TCK release candidate) |
assembled runtime |
That is 1888 MicroProfile tests on the assembled runtime, and 1707 for Servlet next to them. Two honest footnotes. The Telemetry and OpenAPI runs use the release candidates of the 7.2 TCKs, for the ballot reason given above. And Jakarta Persistence and Messaging are not in this release candidate.
Quality, and where it stands
Until this month, quality at Vidocq meant tests and TCKs. On 21 October we added the other half. SonarQube runs on our
own infrastructure, at https://sonar.vidocq.dev, behind the same single sign-on as the forge, with JaCoCo
coverage. A shared action of our CI runs the analysis on the pull requests of each brick and posts one comment
on it. It runs in report mode: it never blocks a merge. A merge still means reading the comment, and we learned that
on the second day, when a pull request with a new finding went in and turned Chappe’s gate red on main.

The first thing it did was to measure honestly. Chappe showed 14.7% coverage, which was false: its tests live in other modules and JaCoCo read each module alone. With one aggregate report, the figure was 82.7%. Then we cleaned, brick by brick, starting with the ones we know best:
| Brick | First analysis, 21 October | Today |
|---|---|---|
Chappe |
30 bugs, 415 code smells, coverage 14.7% (measurement) |
0 bugs, 0 vulnerabilities, 0 smells, coverage 82.0%, gate passed |
Vauban |
30 bugs, 3 vulnerabilities, 1251 code smells, coverage 65.8% |
0, 0, 0, coverage 86.1%, gate passed |
Foy |
47 bugs, 2 vulnerabilities, 578 code smells, coverage 85.1% |
0, 0, 0, coverage 86.5%, gate passed |
The rest of the family is the backlog, and here it is as it stands this morning, not rounded:
| Brick | Lines | Coverage | Bugs | Vulnerabilities | Code smells |
|---|---|---|---|---|---|
Vidocq runtime |
49,769 |
82.7% |
85 |
37 |
1,181 |
Vauban |
38,583 |
86.1% |
0 |
0 |
0 |
Foy |
16,981 |
86.5% |
0 |
0 |
0 |
Cassini |
15,664 |
43.2% |
20 |
13 |
594 |
Champollion |
13,984 |
59.9% |
25 |
6 |
541 |
Mansart |
11,954 |
43.9% |
24 |
6 |
531 |
Chappe |
11,673 |
82.0% |
0 |
0 |
0 |
Grimm |
10,286 |
60.4% |
3 |
7 |
239 |
Ibarra |
9,309 |
85.4% |
2 |
9 |
493 |
Humboldt |
7,883 |
65.5% |
8 |
0 |
151 |
Cyrano |
6,085 |
64.0% |
7 |
14 |
193 |
Peano |
5,359 |
77.0% |
9 |
0 |
188 |
Heisenberg |
3,859 |
53.9% |
8 |
4 |
167 |
Dirac |
3,828 |
68.2% |
8 |
3 |
76 |
Ravel |
2,883 |
66.7% |
0 |
3 |
167 |
Cervantes |
2,757 |
66.9% |
7 |
5 |
56 |
Knock |
1,298 |
82.8% |
0 |
0 |
16 |
Seventeen analysed projects, about 212,000 lines of Java, and about 10,700 tests counted by Sonar. Two sentences on what
the table says. The runtime itself has 85 open bugs and a gate that fails on main: that is the next campaign, ahead
of any new feature work, and the coverage of Cassini and Mansart (about 43%) is the first thing to raise. And the
vulnerability column is the one we have read least; it is a list to triage, not a verdict, and a share of it will turn
out to be false positives we will mark as such, with a comment, in Sonar.
Sonar and JaCoCo are the only analysis tools in place. Error Prone, NullAway, a secret and vulnerability scanner for dependencies, an architecture test and an API-compatibility check are planned, in report mode first, and each brick’s gate becomes blocking when we have reviewed that brick, at 0.4.0.
What changes when you upgrade from 0.3.0
Most of it is additions. These need an action, or a look:
-
The application parent.
vidocq-runtime-parentis now a parent made for applications; the runtime’s own build moved tovidocq-runtime-build. Upgrading is bumping one version. Under your own parent, importvidocq-runtime-bominstead. -
The dev console is no longer a dependency. Remove
vidocq-runtime-devconsole-extensionfrom your pom;vidocq:devadds it. Keep it only if a test reads the console. -
Config and Rest Client need their codegen bundle,
vidocq-runtime-ravel-config-extension-codegenandvidocq-runtime-cyrano-rest-client-extension-codegen, unless the application parent (or the plugin declared as a build extension) wires them for you. -
vidocq:modularizeis nowvauban:modularize, inio.vidocq.vauban:vauban-maven-plugin, with its properties renamedvauban.modularize.*. -
vidocq devandvidocq startrun your project, throughmvn vidocq:devandmvn vidocq:run, with./mvnwwhen there is one. They need a project, and they honour its pom. -
Chappe applies
writeTimeout. A client that stalls while reading is cut after 30 seconds by default. -
Vauban follows the specification more closely.
@AroundInvokeno longer runs around lifecycle callbacks, and inherited and default methods are intercepted: afinalbean bound only through a default method is now a deployment error. An application compiled with the previous processor must be recompiled. -
Two mounts on one prefix fail at startup, naming both extensions, where one used to be silently unreachable; a mount on
/no longer hides the others. -
Servlet applications answer in UTF-8 by default, and the debugger listens on this machine only.
-
Champollion no longer ships the Annotation API, and in Mansart
@Enumerated(ORDINAL)stores the index andSTRINGthe name (an enum without the annotation keeps storing its name). -
JPA left Mansart. Jakarta Persistence is a project of its own now, Noether; Mansart keeps Jakarta Data and Transactions. Noether is not in this release candidate.
Try it
0.4.0-RC1 is the latest release on Maven Central, so the installer picks it up:
curl -fsSL https://vidocq.dev/install.sh | sh
vidocq version        # Vidocq CLI 0.4.0-RC1
vidocq create --name my-app -x cassini-rest -x knock-health
cd my-app
vidocq dev
The project it writes is on vidocq-runtime-parent 0.4.0-RC1, and builds with nothing but Maven Central. We checked it
the way you would meet it: a fresh Maven repository that can reach Central only, then vidocq build jlink (5 seconds,
a 40 MB image) and the image’s own launcher, which reports Started in 120 to 126 ms on three runs.
To upgrade an existing application, bump the parent (or the BOM) to 0.4.0-RC1 and run vidocq doctor: it reads your
project and says what to change, and --fix makes the changes it can.
The getting-started guide, the full what’s new and the TCK page are on the 0.4.0-RC1 line of the documentation. If something does not work, tell us on CodeFloe: a release candidate is the moment when a report costs us the least.
What is next
0.4.0 is planned for the end of November: the MicroProfile 7.2 finals once they are on Maven Central, the TCKs run
again on them, the static analysis gates reviewed brick by brick, and Jakarta Persistence through Noether if it is
ready. The registry behind vidocq extension list --available is the catalog shipped with your CLI; a live catalog
belongs with the web project initializer we want at start.vidocq.dev
(vidocq#17). And we will keep doing the empty-directory audit before every
release, because the bugs it finds are the ones we no longer see.
Fixes since 0.3.0
Every bug we reproduce goes into the BUG.md of its repository, with a symptom, a minimal reproduction and a status.
Since 0.3.0 the files of eight repositories record at least 169 closed entries: Vidocq 46, Vauban 56, Foy 34,
Grimm 16, Humboldt 8, Cyrano 7, Ravel 1 and Knock 1. The other bricks track theirs in the same place; their count is
not in this number. Here they are by brick, grouped by what they had in common, with the id of the entry in
brackets; read the BUG.md of the repository for the symptom, the reproduction and the test that now covers it.
Vauban (56)
Qualifier members, everywhere. The largest family, found in one audit on 14 September, is member values of
annotations being lost or flattened: on field injection points (enum, Class, char, byte, short, array and nested
annotation members dropped, 20260914-02), in container-built qualifier instances (equals and hashCode ignored
@Nonbinding, 20260914-03), in asynchronous observers and in observers of members an extension made non-binding
(-06, -07), in interceptor bindings declared by an extension (-08), on @Inherited qualifiers (-09), on qualifiers added
by an @Enhancement (-10), and on synthetic beans and observers (-15). Boot validation ignored member defaults, so @Q
and @Q("default") never matched (-01); an injection failure was swallowed and left the field null (-17); and a
producer’s disposer ran twice (-18).
Interception of inherited and default methods. A client proxy did not forward an interface default method
(20261004-02); the run-time intercepted subclass skipped an inherited protected or package-private method (-03); an
interceptor bound to a default method never ran (-04); a bean bound only through an inherited method could not be
deployed on the module path (-05); the generated sources did not compile for a type variable or an inaccessible type of
an inherited member (-06, -09); an unproxyable intercepted bean was not reported as a deployment problem (-07); and a
class whose name contains $ produced a subclass that did not compile (20261007-01).
Builds that do not change between runs. The bytes of a run-time-generated subclass depended on what the JVM had loaded
before (20261007-02) and the order of _VaubanComponents changed from one build to the next (-04), so builds were not
reproducible. The plugin did not list the $$Intercepted subclasses it pre-generates (-05). Class-File bytecode took
the build JDK’s class-file version instead of the release’s (20260911-01).
Extensions and build-time enhancement. @Enhancement lost annotation member values (20261008-05) and field,
initializer and parameter additions at boot (20261009-03); @Registration did not see the beans an enhancement
creates (20261008-03); application stereotypes were not bean-defining at build time (-04); synthetic bean parameters
that were arrays, annotations or class infos were silently dropped (-02); a context registered by an extension was lost
under the processor (20261010-04).
The layer and the runtime. The Vauban layer could not be created inside a jlink image (20260912-02); the layer
loader ignored the versioned entries of a multi-release jar (20261013-02) and defined classes without a code source
(-01); default SE discovery read every beans.xml as bean-discovery-mode="all" (20261010-01); an intercepted bean in
a non-exported package failed at creation (-02); a nested bean’s generated classes took its canonical name and could
not load (20260912-01); and there was no RequestContextController nor @ActivateRequestContext, the imperative
request context being shared by every thread (20261010-05).
Foy (34)
Sessions. changeSessionId threw UnsupportedOperationException (20261009-05); expired sessions were dropped without
sessionDestroyed and with the wrong last-accessed time (-06); tracking modes were not enforced (-07); session
listeners ran while the session or its manager held locks (-14).
Dispatching and paths. Form POST parameters were ignored (20261007-01); a filter mapped by pattern and by servlet name
ran twice (20261008-02); forward and include dropped an application’s wrapper (20261009-01); getServletPath and
getPathInfo were not percent-decoded (-02) and decoded paths leaked into dispatch URIs (-04); error pages showed the
error location’s paths to the default servlet only (-03); the dispatch query string was decoded as UTF-8 whatever the
request encoding (-12); and `web.xml’s version was never the effective Servlet version (20261011-12).
Async and upgrade. An async timeout let the pipeline thread and an async thread write the response at the same time
(20261010-02); startAsync() was accepted after upgrade() (-04); a non-blocking write still in flight was cut when
a WebConnection closed (-05); upgrade() during an ASYNC dispatch was silently dropped (-06); and there was no CDI
context on AsyncContext.start() threads nor in AsyncListener.onComplete (-07), nor in error pages (-08). The CDI
request context was never active for a servlet request (-01).
Security. CLIENT-CERT authentication was not supported (20261011-03); a fragment conflict on security-role-ref was
silently resolved (-08); constraint matching was case-sensitive where the file system is not (-05); a denial on the
redirect or unmapped branch ran without request listeners (-07); and the in-memory identity store encoded passwords with
Charset.encode (-09).
Where Foy meets Chappe. The HTTP/1.1 writer truncated header characters to one byte, which allowed header injection (20261009-11), and an over-cap request body was drained without bound (20261011-11). Both are fixed in Chappe.
Vidocq runtime, CLI and plugin (46)
The CLI. vidocq dev and vidocq start ran an empty runtime (20261006-04); the CLI’s HTTP clients never ran a request
(-03); extension list, info and doctor never saw the project’s extensions (-01). extension add declared a second
maven-compiler-plugin (20261023-01), may have wired the codegen bundle into a profile or pluginManagement (-03),
wrote into <dependencyManagement> when it came first (-08), and left empty <build><plugins> and <dependencies> after
remove (-05, -07). A processor path block without combine.children="append" silently lost the Vauban indexer (-02).
The help showed extension ids that did not exist (-04), and the catalog described mansart-data as Jakarta Persistence
(20261024-03).
vidocq create. Extensions were written in an order that changed from run to run (20261024-01); the application took
the runtime’s version (-06); the pom carried workarounds for bugs fixed since 0.2.x (-07); there was no Maven wrapper, so
doctor warned on the project it had just written (-08); --name demo-app named a class DemoAppApp (-09); every build
asked for a provides it did not need (-10); extension add mansart-persistence wrote a coordinate that does not exist
(-04). A scaffolded application booted in place and lost its generated code in a jlink image (20261010-01).
Build, packaging and IDEs. An application with its own version resolved every Vidocq artifact at that version
(20261006-02); a vidocq:jlink profile could not be read because ${vauban.version} had gone (20261025-02); every
application warned of a plugin managed twice (-01); VS Code could not import an application on 0.4.0’s parent (-04);
Eclipse built an application with no bean index (-06); IntelliJ’s build dropped the annotation processor output
(20261012-01) and its Rebuild Project failed on the H2 module (20261019-01); an application compiled without Vauban’s
processor started without its beans and said nothing (20261025-03); an enriched jar had no folder entries, so Vaadin’s
development mode copied no frontend file (20261022-01); a Vaadin AppShellConfigurator made every page answer with a
reset connection in a jlink image (20261023-06); vidocq:dev and vidocq:run answered 404 and 500 from an empty target/
(20261026-01).
Runtime behaviour. @Inject @RestClient was unsatisfied and a Rest Client application could not be linked
(20261008-01); @Inject @ConfigProperty failed the compilation (20261001-01); a Rest Client application with no REST
server had no JSON-B provider (20261010-02); @ApplicationPath was ignored on an Application without a bean-defining
annotation (20261011-02); a mount on / hid every mount registered after it (-03); a servlet application under a
context path other than / answered 404 (-04); the @WebListener of a web fragment that an absolute ordering excludes
was registered (20261018-01); an application-layer module requiring a JDK module missing from the boot layer failed
(20261014-02).
MicroProfile and the other bricks
-
Grimm (16).
/openapiwas lost in a modular application because Grimm shipped automatic modules (20261001-01); merged schemas lost properties of the higher-priority source (20261004-04); theOASModelReadermodel overrode the static file, the specification’s order reversed (-08); staticfile:references of parameters, request bodies, responses and callbacks were lost (-05);@Schemaand@SchemaPropertymapped a few attributes only (-07);examples()andconstValuewere not read as JSON (-12, -06); Bean Validation on scalar parameters was ignored by the generated model (-03); and under Weld or Open Liberty its beans did not load, and two containers in one JVM documented each other’s resources (20261010-01, -02). -
Humboldt (8). On the module path: OpenTelemetry’s
ComponentLoaderlookups failed (20261004-01), the OTLP compressor registry used the default loader (-04), and the SDK and exporter jars could not reach the internal packages of the API (-03). The OTLP/JSON metric encoder dropped double data points and synchronous gauges (-02).@WithSpanand the server filters were not discovered under Weld SE (20261009-01), and on a pull request the CI TCK run tested `main’s modules instead of the branch’s (20261007-01). -
Cyrano (7).
RestClientBuilder.newBuilder()threwServiceConfigurationErroron the module path (20261008-01); the runtime-fallback proxy could not be defined for an interface of another named module (-02);onNewBuilderran up to three times per builder (-03); an asynchronous method could run its response filters on the caller’s thread (-05); no@RestClientbean for an application’s interface at build time (-06); and every Rest Client application gotreactive-streams, an automatic module, and could not be linked (-07). -
Ravel (1).
@Inject @ConfigPropertydid not compile, then did not start, under the Vauban processor (20261001-01). -
Knock (1). Outside Vauban, every Knock bean was dropped: a woven constructor took a
vauban-apitype that was onlyprovided(20261010-01). -
Cassini, Chappe and Mansart. An unreadable request entity now answers 400, not 500, and
NoContentExceptionbecomes aBadRequestExceptionas §4.2.4 requires; a REST resource without a scope is no longer a 404;writeTimeoutis actually applied and connections close gracefully so the last response survives;@Enumeratedis honoured.
Transparency: the audit described here was run, and this post drafted, with the help of Claude, which also wrote part of the code it talks about. The decisions, the measurements we kept and the opinions are ours.