

Vidocq 0.4.0-RC2 is on Maven Central. Eleven days after RC1, the whole family went out again: eighteen
repositories tagged v0.4.0-RC2, from vidocq-parent to the runtime and its CLI, with about 1,050 commits since
v0.4.0-RC1. It is still a release candidate, and we want you to try it before 0.4.0.
Three things to know about it:
-
It is fast. On a 2018 Mac mini, one small REST application on Vidocq serves 80,000 requests per second with a p99 latency of 8.8 ms, starts in 0.87 seconds and holds 127 MB at rest. The whole application weighs 2.8 MB.
-
It restores from a snapshot. With CRaC, a warmed-up Vidocq application comes back in a fresh container in about 400 ms, whatever its start-up took.
-
It is a joy to work with.
vidocq devstarts your database, reloads in about two seconds, runs your tests and names the one that fails;vidocq doctorchecks the project;vidocq build dockerworks on macOS, Linux and Windows. And theopenslines are not your job any more: in the session below, you write none.
The full list is in the What’s new of the runtime and in the What’s new of the ecosystem, which links each brick’s own page.
It’s fast
The numbers below are Vidocq’s own, and nothing else: no ranking, no other framework, only what one small REST application on Vidocq does on one machine. And not a big machine: a Mac mini from 2018, the one with the Intel Core i7-8700B, turned into a Linux bench box, turbo off. The application got four of its six cores at most.
The JVM is Eclipse Temurin 25 with the G1 collector and a fixed 1 GB heap. That is all: no native image, no AOT cache, no CRaC, no tuning flag. The application is a Todo API written the way you would write it: a Jakarta REST resource, a CDI bean, JSON both ways, 1,000 todos kept in memory.
80,000 requests per second
The load comes from wrk2, on 2 cores of its own, with 100 connections. wrk2 sends requests at a constant rate and measures latency from the moment each request should have been sent, so a server that falls behind cannot hide it. The mix looks like a real Todo client: 65 % reads of one todo, 20 % creations, 10 % lists of 100 todos and 5 % updates. Vidocq gets 4 physical cores (8 hardware threads), and we call a rate sustained when at least 98 % of the requests asked are served and the p99 latency stays under 10 ms.
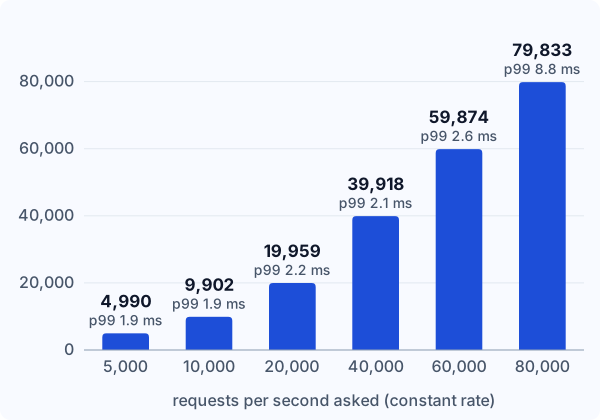
| Requests per second asked | Requests per second served | p99 latency |
|---|---|---|
5,000 |
4,990 |
1.93 ms |
10,000 |
9,902 |
1.91 ms |
20,000 |
19,959 |
2.18 ms |
40,000 |
39,918 |
2.08 ms |
60,000 |
59,874 |
2.56 ms |
80,000 |
79,833 |
8.81 ms |
Every rate is sustained. From 5,000 to 60,000 requests per second, 99 % of the answers come back in about 2 ms, and the curve is flat: Vidocq barely notices the load. At 80,000 requests per second, the highest rate we asked for, the p99 rises to 8.8 ms, still under the line. We did not ask for more, so the ceiling is somewhere above.
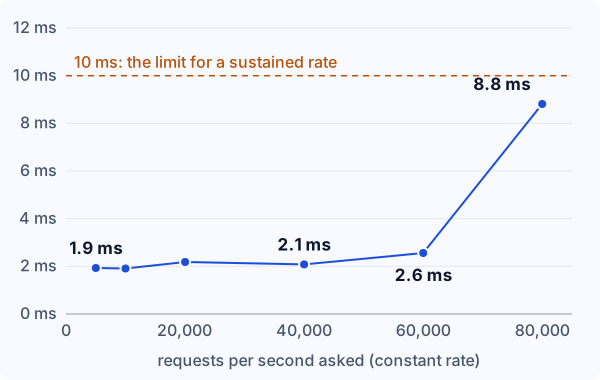
Under the hood, things stay calm. At 40,000 requests per second, the server keeps about three of its eight hardware threads busy. Over the whole life of that container, the garbage collector runs 27 times, and its longest pause is 6.8 ms. Each connection has its own virtual thread and your code stays plain, blocking Java: there is no thread pool to size and no reactive code to write.
Under a second to start

Start-up is measured from the moment the container starts to the first 200 answer of the health endpoint, as the
median of 7 cold starts, each in a fresh container.
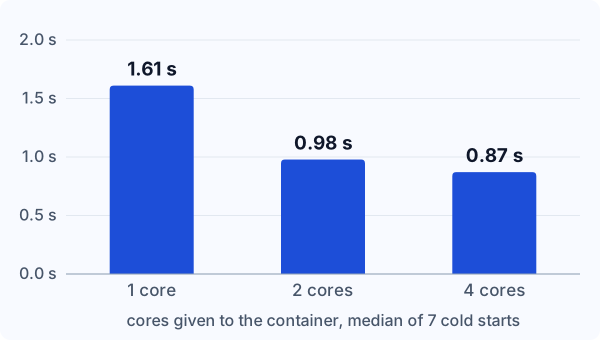
On 4 cores, Vidocq is up in 0.87 seconds, and it answers its first real request, the list of 100 todos, in 44 ms. Even on a single core, it is up in 1.61 seconds. When Vidocq starts there is nothing to discover and nothing to generate: it loads about 1,900 classes, wires what was already wired, opens its socket and answers.
Travelling light

The memory below is the resident memory of the whole process (RSS), on 4 cores, read 10 seconds after the application is ready, then again after 20 seconds of traffic at 1,000 requests per second.
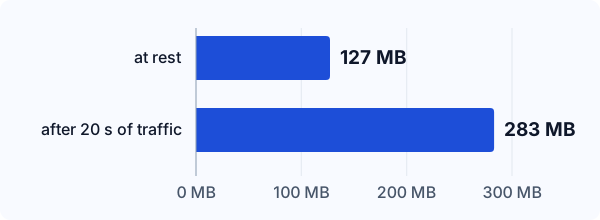
At rest, Vidocq holds 127 MB, with 25 threads; after its first 20,000 requests, 283 MB. The heap was set to a full 1 GB from the start: these figures are what the process actually touches, not a limit we squeezed it into. And the application itself, with all of Vidocq and every Jakarta API jar it runs on, is 2.8 MB on disk, the JVM aside.
Why it’s fast: even less reflection
None of this comes from a trick in the application. It comes from what Vidocq does before the application runs: the CDI wiring, the JSON binding, the REST routing and the data access are generated as code at build time, so there is no reflection and no classpath scanning to pay for at start-up or per request. RC2 pushes that further:
-
JSON-B without reflection for almost everything you exchange. The types your resources take and return get their binding generated at build time: records and final classes, but also plain classes with getters and setters and their hierarchies (
Product extends BaseEntity), date and number formats, arrays, adapters, serializers,@JsonbCreator, polymorphism over a sealed interface, the entity of aResponse, and the DTOs of a library. -
Jakarta Data without
opens. Mansart reaches your entities, your repository implementations and your projection records through code its processor generates, including for@Repositoryinterfaces shipped in a library. -
Expression Language, Config and the MicroProfile annotations at build time. Peano generates the accessors of the
@Namedbeans your pages read, Ravel the factories of your@ConfigPropertiesclasses and their converters; Fault Tolerance, Metrics and OpenAPI read your annotations from companions written when your code compiles, and the JWT extension runs at compile time too. -
Less work per request in CDI. Request-scoped and dependent beans, private
@Injectfields and interceptor methods no longer go through reflection, and a bean is read once instead of at each creation. -
Your dependencies get their code too.
vidocq:generatenow runs on every build: the jars your application depends on get the beans, repositories and bindings their bricks generate for them, with nothing to declare.
And when something still falls back to reflection, Vidocq says so: a class generated at run time is listed at boot, and a type that keeps the reflective JSON mapping is named in the build output, with the reason. The internals page lists every generator and what it produces.
And when a second is still too long
If 0.87 seconds is still too slow for you, RC2 supports CRaC. Take a snapshot of a warmed-up application once, and
every new container restores it in about 400 ms, whatever the start-up took: on an application that needs eight
minutes to warm up, that is 1,300 times faster than a cold start. Your own code takes part through two CDI events,
Checkpoint and Restore, to let go of a client or a file before the snapshot and take it back after, with no
jdk.crac in its code. The whole story, numbers included, is in
Checkpoint, Restore, Answer: Vidocq on CRaC, and the how-to
in the documentation.
Developer joy: ten minutes with the RC2 CLI
Fast is good. Pleasant is better. Most of RC2 is about the minutes you spend in front of your terminal, so here they
are, played for real with the RC2 CLI on a Mac (Apple M5 Max, Docker through OrbStack). The outputs are copied from
that session, with the log prefixes trimmed and a few lines cut (…).

An application with a database, in one command
curl -fsSL https://vidocq.dev/install.sh | sh
vidocq create --name todo -g com.acme -x cassini-rest -x mansart-data -x flyway-migration
ℹ Scaffolding project 'todo'…
✔ Added org.postgresql:postgresql (the JDBC driver of the vidocq-runtime-devservice-postgres dev service)
✔ Wired vidocq-runtime-devservice-postgres (on vidocq-runtime-maven-plugin, in test scope with vidocq-runtime-devservices-junit)
✔ Created src/main/resources/db/migration (where flyway-migration reads its files; opened in module-info.java)
✔ Project 'todo' created.Jakarta Data needs a connection pool, so mansart-data brought mansart-pool along. The CLI also declared the
PostgreSQL dev service, for vidocq dev, vidocq test and a plain mvn test, added the driver, and wrote the
pool’s settings into vidocq.properties, commented, for the day you run outside dev mode:
# mansart-pool: settings written by the Vidocq CLI, yours to edit
# The PostgreSQL dev service sets vidocq.pool.url, .username and .password under vidocq dev, vidocq test and
# mvn test. Everywhere else (vidocq run, the packaged application), the pool needs them: uncomment them, or
# set them with `vidocq config set`, which uncomments the line in place.
#vidocq.pool.url=jdbc:postgresql://localhost:5432/todo
vidocq dev: the database comes with it
cd todo
vidocq dev
[INFO] Vidocq checkpom: 4 extension(s) and 3 codegen path(s) — all aligned.
[INFO] Vidocq check-module-info: module-info of 'com.acme.todo' satisfies all 1 extension requirement(s) and opens the 0 package(s) the runtime reaches by reflection.
[INFO] DevService 'postgres' starting…
[INFO] Container postgres:16-alpine started in PT1.357817S
…
devservices Dev services | 0 ms
1 service: postgres (postgres:16-alpine at localhost:32783) — vidocq:dev
…
rest REST (Cassini) | 0 ms
1 resource class, 1 route, 1 provider at /
GET http://localhost:8080/hello HelloResource#hello
devconsole Dev console | 0 ms
http://127.0.0.1:8888/
…
Vidocq - Started in 372.412 ms (process running for 509 ms)No database to install and no URL to copy: the dev service started a PostgreSQL container and handed its coordinates to the pool. The dev console is on port 8888, with a panel per extension.
Now the code. A migration, an entity, a Jakarta Data repository and a resource, in a new package todos:
CREATE TABLE todos (
    id    BIGSERIAL PRIMARY KEY,
    title VARCHAR(255) NOT NULL,
    done  BOOLEAN NOT NULL DEFAULT FALSE
);
@Entity
@Table(name = "todos")
public class Todo {
@Id
@GeneratedValue
private Long id;
private String title;
private boolean done;
// getters and setters
}
@Repository
public interface Todos extends BasicRepository<Todo, Long> {
List<Todo> findByDone(boolean done);
}
@Path("/todos")
@ApplicationScoped
@Produces(MediaType.APPLICATION_JSON)
@Consumes(MediaType.APPLICATION_JSON)
public class TodoResource {
@Inject
Todos todos;
@GET
public List<Todo> list(@QueryParam("done") Boolean done) {
return done == null ? todos.findAll().toList() : todos.findByDone(done);
}
@POST
public Todo add(Todo todo) {
return todos.save(todo);
}
}Save, and vidocq dev does the rest:
[INFO] Changes detected — recompiling...
[INFO] Hot reload signalled after 1940 ms (in-JVM layer swap).
Migrating schema "public" to version "1 - todos"
Successfully applied 1 migration to schema "public", now at version v1 (execution time 00:00.004s)
Mansart Data: 1 repository(ies) wired: [com.acme.todo.todos.Todos]
…
  mansart-data  1 entity, 1 repository, 1 method
  rest        2 resource classes, 3 routes, 1 provider at /
  anomalies   none
Vidocq - Started in 100.206 ms (process running for 40342 ms)
$ curl -X POST localhost:8080/todos -H 'Content-Type: application/json' -d '{"title":"Try Vidocq 0.4.0-RC2"}'
{"done":false,"id":1,"title":"Try Vidocq 0.4.0-RC2"}
$ curl 'localhost:8080/todos?done=false'
[{"done":false,"id":1,"title":"Try Vidocq 0.4.0-RC2"}]Look at what did not happen: module-info.java did not change. The entity, the repository and the JSON both ways run
on code generated at build time, so the new package has nothing to open. When a package does need an opens line,
because a library reaches it by reflection, vidocq dev now writes the line itself, prints it and carries on, where
it used to stop. And if you would rather never think about it, vidocq create --open-module makes the application an
open module, and no tool will ever ask you for an opens line again.
Tests that say what broke
A first test, with @VidocqTest, which starts the application on the dev services:
@VidocqTest
class TodoResourceTest {

    @Test
    void createsATodo(VidocqApplication application) {
        VidocqResponse created = application.post("/todos", "application/json", "{\"title\":\"Write a test\"}");

        assertEquals(201, created.status(), "a new todo answers 201 Created");
        assertTrue(application.get("/todos").body().contains("Write a test"));
    }
}
vidocq test --once runs every test once and exits with the verdict, for your CI and your scripts:
[INFO] Vidocq test — running every test once
[INFO] Tests: 1 passed, 1 failed, 0 skipped in 3.4 s (run-all)
[INFO]   FAILED com.acme.todo.todos.TodoResourceTest#createsATodo(VidocqApplication) — AssertionFailedError: a new todo answers 201 Created ==> expected: <201> but was: (200)
[INFO] Log: target/vidocq-dev-tests.log
✘ Maven exited with code 1.
The failed test, and why, instead of a count. The resource answers 200; make it answer 201 Created:
    @POST
    public Response add(Todo todo) {
        return Response.status(Response.Status.CREATED).entity(todos.save(todo)).build();
    }
vidocq dev reloads and, with continuous testing, runs the tests again on its own:
[INFO] Changes detected — recompiling...
[INFO] Hot reload signalled after 2246 ms (in-JVM layer swap).
Vidocq - Started in 74.706 ms (process running for 204687 ms)
[INFO] Tests: 2 passed, 0 failed, 0 skipped in 3.4 s (change)
A doctor, and a Docker image from a Mac
vidocq doctor reads the project and says what is wrong before the build does. On this one, nothing:
Vidocq doctor — environment & project checks

  ✔ Java version      Java 25
  ✔ Maven wrapper     mvnw found
  ✔ Vidocq project    pom.xml references the Vidocq runtime
  ✔ Config            vidocq.properties — 1 key, all recognized
  ✔ Extensions        5 extensions in the runtime dependencies
  ✔ Codegen bundles   2 wired by vidocq-runtime-maven-plugin
  ✔ Vauban indexer    wired by vidocq-runtime-maven-plugin
  ✔ Dependency codegen vidocq:generate runs on every build (vidocq-runtime-parent)
  ✔ Module directives module-info.java declares what the extensions need and opens the packages reached by reflection
  ✔ Dev services      1 wired for vidocq dev, vidocq test and mvn test
  …
✔ No blocking issues found.
  13 checks — 13 ok, 0 warning(s), 0 failed
Since RC2 it checks the same opens the build checks, so it no longer says ✔ on a project the build then fails, and
vidocq doctor --fix writes what it can.
Last step, an image for production. On Linux, the jlink image goes into the container as it is. A jlink image built on macOS or Windows holds binaries for that system, so the Dockerfile now links it again inside a Linux JDK:
vidocq build docker[INFO] Tests run: 2, Failures: 0, Errors: 0, Skipped: 0
[INFO] jlink image ready: …/todo/target/dist
[INFO] The runtime image was linked for macOS (Mach-O executable): the Dockerfile links it again inside eclipse-temurin:25-jdk (Linux).
[INFO] Docker image built: todo:1.0.0-SNAPSHOT
[INFO] Run with: docker run --rm -p 8080:8080 todo:1.0.0-SNAPSHOT
✔ Docker image built.The image is 101 MB, Flyway and the PostgreSQL driver included: jlink now gives the automatic modules of your
dependencies a module descriptor on its own. Start it next to a PostgreSQL with VIDOCQ_POOL_URL,
VIDOCQ_POOL_USERNAME and VIDOCQ_POOL_PASSWORD in its environment, and Flyway migrates the schema before the first
request.
And the rest of the toolbox
-
vidocq devsurvives a first build that does not compile: it reports the error and builds again on your next save, instead of exiting. -
Extensions write their settings.
vidocq extension add humboldt-telemetrynames the service and points it at a local collector; a Grafana dev service (grafana/otel-lgtm) shows the traces, and with the pool every SQL statement is a span of the request. JWT gets commented hints, and the Keycloak dev service publishes its issuer, token URL and admin console. -
--helpon every command,JAVA_OPTShonoured by the packaged launchers, and@VidocqTestrequests that carry headers, for a bearer token. -
vidocq updatekeeps the CLI itself up to date, and tells you once a day at most when a newer one is out.
Brick by brick
Beyond what is above, the highlights of each brick’s What’s new page:
- Vauban (CDI)
-
Interceptor methods and private
@Injectfields without reflection; an interceptor may have an@Injectconstructor. - Champollion (JSON-P, JSON-B)
-
CDI beans as adapters; when a module does not open a type, the error gives the
opensline to add. - Cassini (REST)
-
Parameter annotations read once per method, not on every request; conformance fixes on multipart,
UriInfo,UriBuilder, SSE and the client. - Mansart (Data, Transactions)
-
A missing table caught at build time from your Flyway migrations; a method no query derives from fails the build; runs unchanged on other CDI containers.
- Chappe (HTTP)
-
Draining a request body already read no longer allocates, and a response body Cassini writes at once reaches Chappe without being copied.
- Peano (EL) and Ibarra (Pages)
-
A JSP reads
${cart.total}from a@Namedbean with no reflection; a page application lets go of its caches on reload. - Humboldt (Telemetry)
-
OpenTelemetry 1.67.0, which fixes the
tracestateadvisory;http.routeis the resource’s template again. - Heisenberg, Dirac, Ravel, Cyrano, Grimm, Cervantes, Knock, Foy
-
Their annotations read at build time, a synchronous
@Timeouton the caller’s thread, faster REST client calls, an OpenAPI document without the runtime’s own endpoints, and a JWT that stays out of the logs.
Upgrading from RC1
Bump the parent (or the BOM) to 0.4.0-RC2 and run vidocq doctor: it reads your project and says what to change,
and --fix makes the changes it can. Under vidocq-runtime-parent that is usually all. A few things deserve a look:
-
Four more codegen bundles. Metrics, OpenAPI, Fault Tolerance and JWT now run their processor at build time. The parent wires them for you; under your own parent,
vidocq:checkpomfails the build and prints the<path>to paste. See the migration page. -
A repository method no query derives from fails the build, instead of throwing at run time.
-Amansart.unresolvedMethods=warnkeeps the old behaviour. -
Mansart Data brings its SQL dialects: you can drop the one you declared.
-
Behaviour you may notice: a synchronous
@Timeoutmethod runs on the caller’s thread; a typed REST client call throwsWebApplicationExceptionon an error status; the OpenAPI document no longer lists/healthand/metrics; Telemetry exports over OTLP as soon as an endpoint is set. -
vidocq:generateruns on every build.-Dvidocq.generate.skipturns it off.
And three rough edges we found while writing this post, with their workaround until the fixes land:
-
Under
vidocq dev, the first test run of a project whose test dependencies were never downloaded fails to resolve them, because it runs Maven offline. Runvidocq test --once(or./mvnw test) once (vidocq#501). -
The Mansart Data panel of the dev console shows its boot facts only when the application has no Jakarta Transactions:
vidocq extension add mansart-transactionsgives it the query editor back. -
Running
vidocq testwhilevidocq devruns rewritestarget/vidocq-dev-services.propertieswith the test session’s database, which the next dev startup report then shows. The application keeps its own database; restartvidocq devto see its coordinates again.
Try it
The CLI is a Java 25 application with a launcher for each shell, so it runs on macOS, Linux and Windows. 0.4.0-RC2 is the latest release on Maven Central, so the installer picks it up:
curl -fsSL https://vidocq.dev/install.sh | sh
vidocq version        # Vidocq CLI 0.4.0-RC2
vidocq create --name my-app -x cassini-rest
cd my-app
vidocq dev
On Windows, in PowerShell:
irm https://vidocq.dev/install.ps1 | iexA CLI you already have says vidocq update. The
getting-started guide and the
REST and database tutorial are on the 0.4.0-RC2 line of
the documentation. Write a resource, run it, point your favourite load generator at it, and tell us what you measure
on your own machine. If something does not work, tell us on CodeFloe: a
release candidate is the moment when a report costs us the least.
Next comes 0.4.0: MicroProfile 7.2 on its final artifacts, and the security baseline of the
roadmap.
How we measured
-
What was measured. The 0.4.0-SNAPSHOT of Vidocq’s
mainbranch, as deployed on 2026-10-28 for the start-up and memory figures, and on 2026-11-03 for the load figures; each jar is identified by its checksum. The 0.4.0-RC2 release is cut from that line, and the release build itself has not been measured yet. -
Two suites. Start-up and memory come from a suite without JFR or GC logging, on Temurin 25.0.4.1. Load comes from a suite on Temurin 25.0.5 that records JFR and GC logs, and reports a slower start and more memory at rest (1.20 s, 170 MB) for that reason.
-
One machine, one run per rate. Each rate of the load suite ran once, so differences of a few percent are noise. The start-up figures are medians of 7 cold starts.
-
CRaC. The restore figures come from the CRaC post: same machine, Azul Zulu 25.0.4.1 CRaC, Vidocq built from
mainbefore the application events, medians of 3 to 7 runs per tier. -
The CLI session ran once, on a Mac with an Apple M5 Max and Docker through OrbStack; its timings are what the tools printed that day, not a benchmark.
Transparency: this article was written with the help of an AI, Claude.